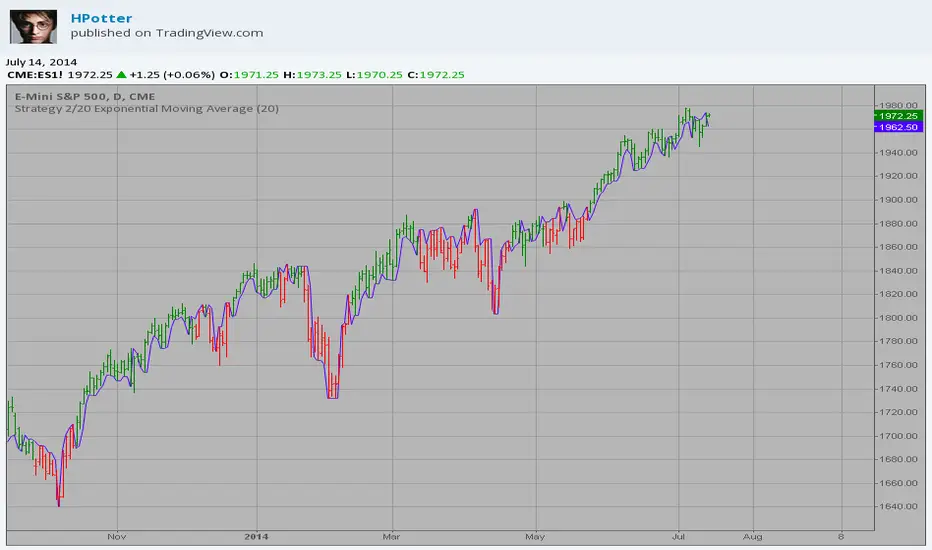
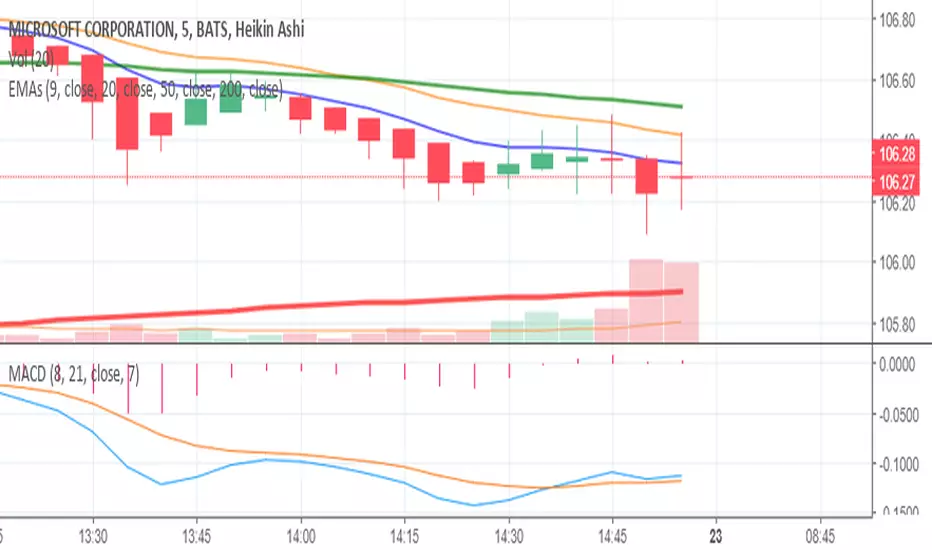
2/20 Exponential Moving Average This indicator plots 2/20 exponential moving average. For the Mov
Avg X 2/20 Indicator, the EMA bar will be painted when the Alert criteria is met.
You can use in the xPrice any series: Open, High, Low, Close, HL2, HLC3, OHLC4 and ect...
Cari dalam skrip untuk "Exponential Moving Average"

Strategy 2/20 Exponential Moving Average Strategy.
This indicator plots 2/20 exponential moving average. For the Mov
Avg X 2/20 Indicator, the EMA bar will be painted when the Alert criteria is met.
You can use in the xPrice any series: Open, High, Low, Close, HL2, HLC3, OHLC4 and ect...
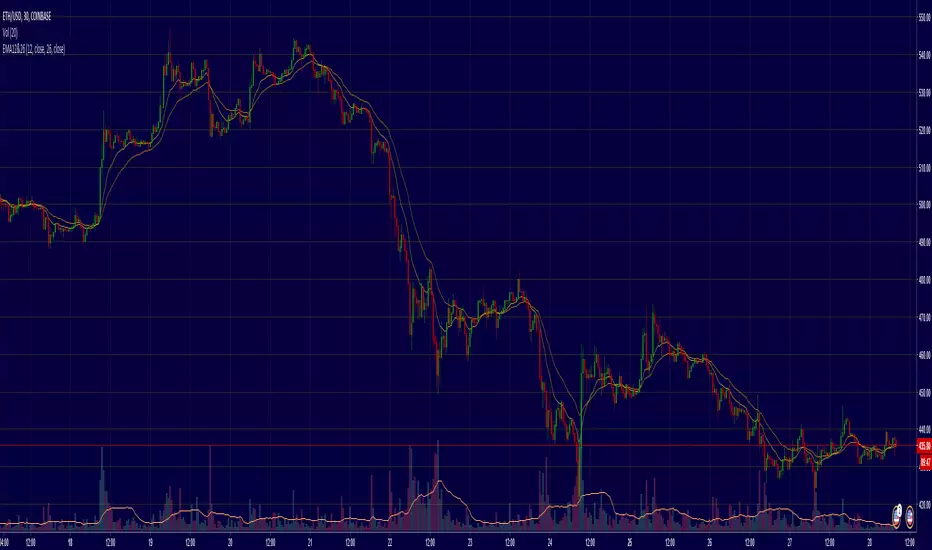
Exponential Moving Averages 12 & 26Exponential Moving Average Indicator for trading 12EMA and 26EMA crossovers.
The 12 and 26 period exponential moving averages (EMAs) are often the most popularly quoted or analyzed short-term averages.
Exponential moving averages Convergence to identify Strength of Exponential moving averages Convergence to identify Strength of the stock.
Description:
This script is developed to find Convergences for many indicators. It analyses Convergences of 20days, 50days, 100days, 150days and 200days exponential moving averages. When all the plotted lines are converged and Price of stock is above the Convergence the stock is bullish, similarly if the price of the stock is below the convergence stock is bearish.
This indicator gives you VWAP and EMA’s for convergence along with Bollinger Bands.
VWAP and Bollinger bands and EMA’s can be altered as you required.
In settings menu we can enable and disable VWAP, EMA’S & Bollinger bands and in style menu even we can choose required EMA
It helps for convergence.

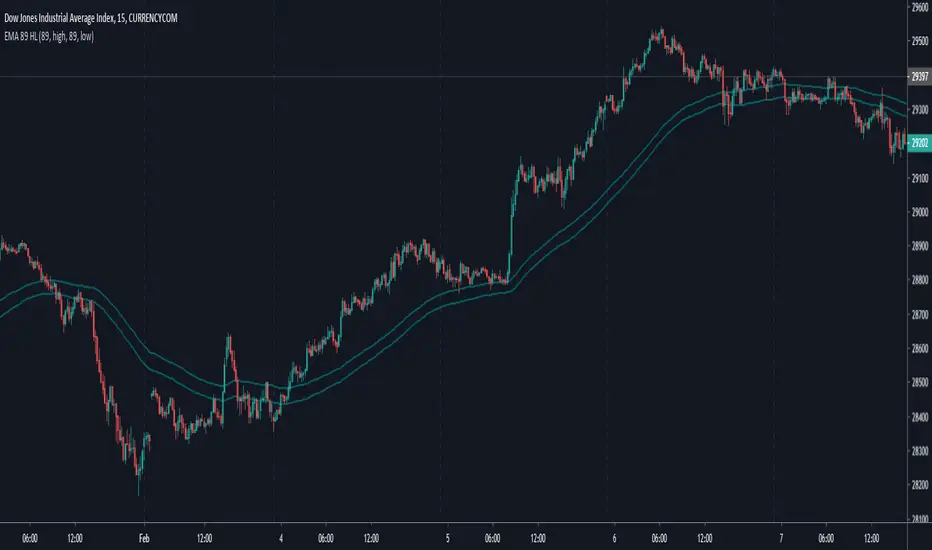
Exponential Moving Average 89Exponential Moving Average 89
Plots Exponential Moving Average 89 High Low
Exponential Moving Averages 9 & 40 NKExponential Moving Averages 9 & 40 NK, used in Currency Markets

Exponential Moving Average with ADR bandIndicator: Exponential Moving Average with ADR Band
This TradingView script calculates and displays an Exponential Moving Average (EMA) along with an Average Daily Range (ADR) band around it. The indicator helps traders identify potential dynamic support and resistance levels adjusted for market volatility. Especially significant moves that originate from the ZONE and reach outside should be taken seriously.
Key Features:
EMA Calculation: The script computes the Exponential Moving Average (EMA) of the closing prices over a user-defined period.
ADR Band: It calculates the Average Daily Range (ADR) using a Simple Moving Average (SMA) of the daily high-low range over the same period.
Adjustable Parameters:
Length: The period for both the EMA and the ADR calculation, which can be set by the user (default is 20).
Multiple: A multiplier for the ADR to adjust the width of the bands around the EMA (default is 1).
Plotting: The EMA is plotted as an orange line. The upper and lower ADR bands are plotted around the EMA, and the area between these bands is filled with a translucent orange color to highlight the channel.
How It Works:
EMA Calculation: The script computes the EMA of the closing prices using the specified length.
ADR Calculation: The daily range (high-low) is averaged over the same length to get the ADR.
Band Creation: The upper band is created by adding the ADR (multiplied by the user-defined multiple) to the EMA. The lower band is created by subtracting the ADR (multiplied by the user-defined multiple) from the EMA.
Visualization: The EMA and ADR bands are plotted, and the area between the bands is filled to create a clear visual representation of the ADR channel.
Usage:
This indicator can be used to gauge market volatility and potential support/resistance zones.
The ADR band provides a dynamic range that adjusts with market conditions, helping traders identify potential breakout and reversal points.
To customize the indicator, adjust the 'Length' and 'ADR multiple' parameters to suit your trading style and the specific characteristics of the asset you are analyzing.

Exponential Moving AveragesCreated by using the Simple Moving Average indicator created by stocksinboxx
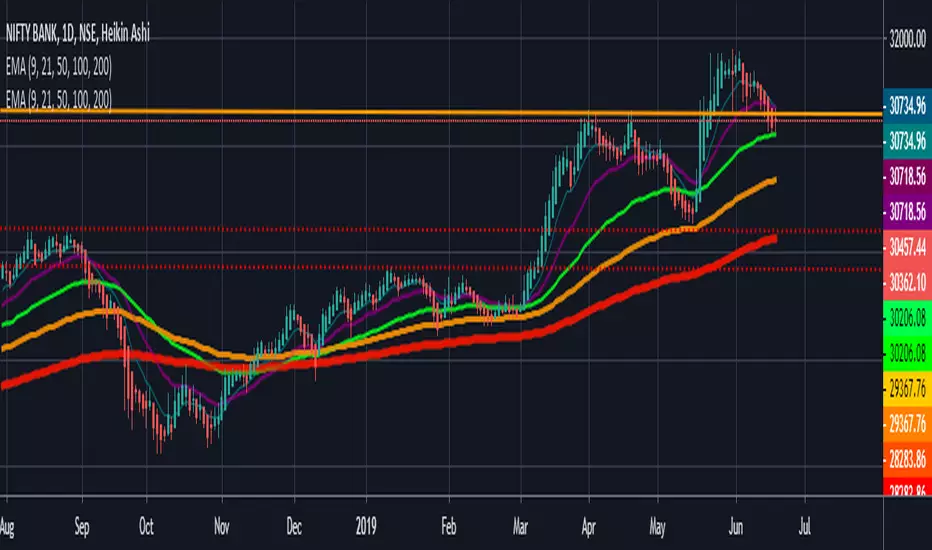
Plots four Exponential Moving Averages on a chart. (9, 20, 50, 200)
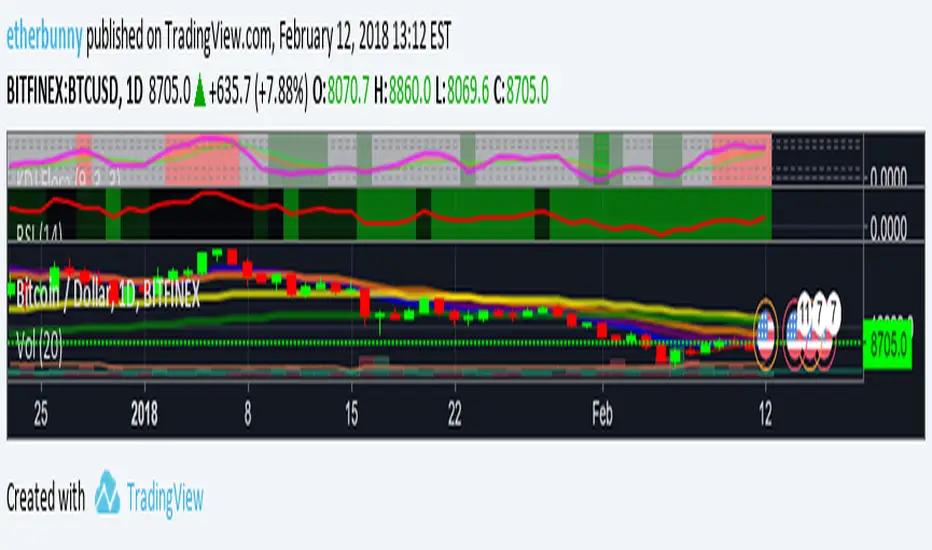
Exponential Moving Averages [etherbunny]This plots the 8, 13, 21, 55 and 100 day exponential moving averages.
Exponential Moving Averages Major Exponential Moving Averages as a single indicator for trading view
the showline = true/false shows/hides the price line of the moving average
Exponential Moving Average Convergence/DivergenceMACD modified with exponential moving averages. Simple.

Exponential Moving Average (by Ethrex)Allows to see how Exponential Moving Averages are computed.
This script is for demonstration purposes and the built-in 'ema' TradingView function will be much faster.

Exponential Moving Average Ribbon 12This indicator shows up to twelve exponential moving average lines at once in a single indicator. Or, to put it another way, an EMA ribbon.
You can turn off individual EMAs at your discretion, showing between none and twelve at a time, and of course you can change the period lengths of each at your discretion.
The last four EMAs are green when bullish and red when bearish. The others will change color slightly too, much more subtly.
Why another one of these? There's a few of these already, but I wanted the ability to quickly turn off and on different EMA lines to see certain things, like support and resistance off an EMA, without having to futz about changing the period length on different ones, and I wanted something with a few more EMA lines than others provided.
I use this with other analysis to help determine trade opportunities.


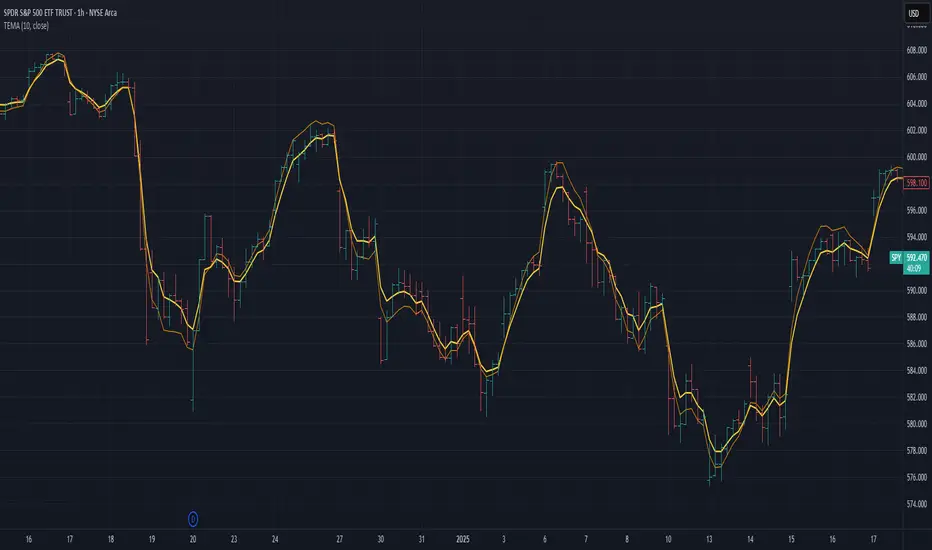
Triple Exponential Moving Average (TEMA)The Triple Exponential Moving Average (TEMA) is an advanced technical indicator designed to significantly reduce the lag inherent in traditional moving averages while maintaining signal quality. Developed by Patrick Mulloy in 1994 as an extension of his DEMA concept, TEMA employs a sophisticated triple-stage calculation process to provide exceptionally responsive market signals.
TEMA's mathematical approach goes beyond standard smoothing techniques by using a triple-cascade architecture with optimized coefficients. This makes it particularly valuable for traders who need earlier identification of trend changes without sacrificing reliability. Since its introduction, TEMA has become a key component in many algorithmic trading systems and professional trading platforms.
▶️ **Core Concepts**
Triple-stage lag reduction: TEMA uses a three-level EMA calculation with optimized coefficients (3, -3, 1) to dramatically minimize the delay in signal generation
Enhanced responsiveness: Provides significantly faster reaction to price changes than standard EMA or even DEMA, while maintaining reasonable smoothness
Strategic signal processing: Employs mathematical techniques to extract the underlying trend while filtering random price fluctuations
Timeframe effectiveness: Performs well across multiple timeframes, though particularly valued in short to medium-term trading
TEMA achieves its enhanced responsiveness through an innovative triple-cascade architecture that strategically combines three levels of exponential moving averages. This approach effectively removes the lag component inherent in EMA calculations while preserving the essential smoothing benefits.
▶️ **Common Settings and Parameters**
Length: Default: 12 | Controls sensitivity/smoothness | When to Adjust: Increase in choppy markets, decrease in strongly trending markets
Source: Default: Close | Data point used for calculation | When to Adjust: Change to HL2/HLC3 for more balanced price representation
Corrected: Default: false | Adjusts internal EMA smoothing factors for potentially faster response | When to Adjust: Set to true for a modified TEMA that may react quicker to price changes. false uses standard TEMA calculation
Visualization: Default: Line | Display format on charts | When to Adjust: Use filled cloud to see divergence from price more clearly
Pro Tip: For optimal trade signals, many professional traders use two TEMAs (e.g., 8 and 21 periods) and look for crossovers, which often provide earlier signals than traditional moving average pairs.
▶️ **Calculation and Mathematical Foundation**
Simplified explanation:
TEMA calculates three levels of EMAs, then combines them using a special formula that amplifies recent price action while reducing lag. This triple-processing approach effectively eliminates much of the delay found in traditional moving averages.
Technical formula:
TEMA = 3 × EMA₁ - 3 × EMA₂ + EMA₃
Where:
EMA₁ = EMA(source, α₁)
EMA₂ = EMA(EMA₁, α₂)
EMA₃ = EMA(EMA₂, α₃)
The smoothing factors (α₁, α₂, α₃) are determined as follows:
Let α_base = 2/(length + 1)
α₁ = α_base
If corrected is false:
α₂ = α_base
α₃ = α_base
If corrected is true:
Let r = (1/α_base)^(1/3)
α₂ = α_base * r
α₃ = α_base * r * r = α_base * r²
The corrected = true option implements a variation that uses progressively smaller alpha values for the subsequent EMA calculations. This approach aims to optimize the filter's frequency response and phase lag.
Alpha Calculation for corrected = true:
α₁ (alpha_base) = 2/(length + 1)
r = (1/α₁)^(1/3) (cube root relationship)
α₂ = α₁ * r = α₁^(2/3)
α₃ = α₂ * r = α₁^(1/3)
Mathematical Rationale for Corrected Alphas:
1. Frequency Response Balance:
The standard TEMA (where α₁ = α₂ = α₃) can lead to an uneven frequency response, potentially over-smoothing high frequencies or creating resonance artifacts. The geometric progression of alphas (α₁ > α₁^(2/3) > α₁^(1/3)) in the corrected version aims to create a more balanced filter cascade. Each stage contributes more proportionally to the overall frequency response.
2. Phase Lag Optimization:
The cube root relationship between the alphas is designed to minimize cumulative phase lag while maintaining smoothing effectiveness. Each subsequent EMA stage has a progressively smaller impact on phase distortion.
3. Mathematical Stability:
The geometric progression (α₁, α₁^(2/3), α₁^(1/3)) can enhance numerical stability due to constant ratios between consecutive alphas. This helps prevent the accumulation of rounding errors and maintains consistent convergence properties.
Practical Impact of corrected = true:
This modification aims to achieve:
Potentially better lag reduction for a similar level of smoothing
A more uniform frequency response across different market cycles
Reduced overshoot or undershoot in trending conditions
Improved signal-to-noise ratio preservation
Essentially, the cube root relationship in the corrected TEMA attempts to optimize the trade-off between responsiveness and smoothness that can be a challenge with uniform alpha values.
🔍 Technical Note: Advanced implementations apply compensation techniques to all three EMA stages, ensuring TEMA values are valid from the first bar without requiring a warm-up period. This compensation corrects initialization bias and prevents calculation errors from compounding through the cascade.
▶️ **Interpretation Details**
TEMA excels at identifying trend changes significantly earlier than traditional moving averages, making it valuable for both entry and exit signals:
When price crosses above TEMA, it often signals the beginning of an uptrend
When price crosses below TEMA, it often signals the beginning of a downtrend
The slope of TEMA provides insight into trend strength and momentum
TEMA crossovers with price tend to occur earlier than with standard EMAs
When multiple-period TEMAs cross each other, they confirm significant trend shifts
TEMA works exceptionally well as a dynamic support/resistance level in trending markets
For optimal results, traders often use TEMA in combination with momentum indicators or volume analysis to confirm signals and reduce false positives.
▶️ **Limitations and Considerations**
Market conditions: The high responsiveness can generate false signals during highly choppy, sideways markets
Overshooting: More aggressive lag reduction leads to more pronounced overshooting during sharp reversals
Parameter sensitivity: Changes in length have more dramatic effects than in simpler moving averages
Calculation complexity: Triple cascaded EMAs make behavior less predictable and more resource-intensive
Complementary tools: Should be used with confirmation tools like RSI, MACD or volume indicators
▶️ **References**
Mulloy, P. (1994). "Smoothing Data with Less Lag," Technical Analysis of Stocks & Commodities .
Mulloy, P. (1995). "Comparing Digital Filters," Technical Analysis of Stocks & Commodities .
Volatility Exponential Moving AverageVEMA is a custom indicator that enhances the traditional moving average by incorporating market volatility. Unlike standard moving averages that rely solely on price, VEMA integrates both the Simple Moving Average (SMA) and the Exponential Moving Average (EMA) of the closing price, alongside a measure of market volatility.
The unique aspect of VEMA is its approach. It calculates the standard deviation of the closing price and also computes the simple moving average of this volatility. This dual approach to understanding market fluctuations allows for a more nuanced understanding of market dynamics.
Key to VEMA's functionality is the dynamic weighting factor, which adjusts the influence of SMA and EMA based on current market volatility. This factor increases the weight of the EMA, which is more responsive to recent price changes, during periods of high volatility. Conversely, during periods of lower volatility, the SMA, which offers a smoother view of price trends, becomes more prominent.
The resultant is a hybrid moving average that responds adaptively to changes in market volatility. This adaptability makes VEMA particularly useful in dynamic markets, potentially offering more insightful trend analysis and reversal signals compared to traditional moving averages.

My exponential moving averages - Suri's EMAs
It's not an indication of anything here, it's just part of my operating in a simple and summarized way, I hope it helps someone.
Suri's EMA's indicator is nothing more than a set of exponential moving averages (EMA). They are 12, 26, 50 and 200.
Attention to the use of the indicator, it is just an INDICATOR, it should not be taken as the main point of your entry, but to guide you in your entries in favor of the trend, whether intra-day or swing.
Created for clear, monochrome screens. Make your adjustments.
Color condition, candles turn green when their close is above EMA 12 and 26.
Color condition, candles turn red when their close is below EMA 12 and 26.
Condition for colors, MME12,26,50 and 200 will turn green with price working above it.
Condition for colors, MME12, 26, 50 and 200 will turn red with price working below it.
Indication for use in time-frames = 5m, 15m, 60m, 240m. (higher hit rates)
How to use the indicator, MME 12 and 26, are the most important and led you to more entries, but we should not only consider them, we have to analyze the whole context to then make a decision.
Indicator was nicknamed by me by "Pullback Pick", it works in a simple way:
In an uptrend or downtrend, the price usually tends to return in the averages or the averages go up to the price, that being said, it is easy to observe that where the price returns would be a pullback from the last movement, so when returning to the averages, the candle that shows strength in favor of this trend, in the EMA's region, becomes a possible entry, with its stop below or above this "pullback" formed, because the stop goes there, because usually when the price returns on the EMAs they tend to to hold and replay the price in favor of the trend.
My observations:
I like to enter when the price returns to the averages smoothly, without much movement, when it touches the average 12 or 26 it is an entry, but an entry without confirmation, the gain is greater, but the chance of being stopped is higher, I like it when the price is close to the 12 and 26 averages and leaves a small candle or doji on this pullback, my entry goes to the breakout of this candle and the stop behind the candle.
THERE IS NO MIRACLE, THERE IS NO 100% HIT RATE, SO USE STOP.
Aaaaaaaaaa I was forgetting.... and the target???
As it is a trend following setup, it is cool to leave a trailing stop or update the stop as new bottoms or tops are formed.
Targeting in 1v1 is good, setup pays a lot!
Targeting in 2x1 is too good, setup pays well!
Making a target in 3x1 is more than good, setup pays sometimes, then from now on, it depends on where you are entering this "PULLBACK", if it is in the first wave, in the second, if you are going to lateralize, the market is SOVEREIGN, put in the pocket that is no longer on the market, oh it's yours!
That's it, doubts, send it there, suggestion, opinion, whatever you want.
Added a symbol at the crossing of the 12 and 26 moving averages.
I am so sorry, but i dont speak english, use google translate.
Português.
Não se trata de indicação de nada aqui, é apenas parte do meu operacional de maneira simples e resumida, espero que ajude alguém.
Indicador Suri's EMA's, nada mais é do que um conjunto de médias móveis exponenciais(MME). São elas 12, 26, 50 e 200.
Atenção para o uso do indicador, ele é apenas um INDICADOR, não deve ser tomado como o ponto principal de sua entrada, mas sim de te balizar nas suas entradas a favor da tendência, seja ela intra-day ou swing.
Criado para telas claras e monocromáticas. Façam seus ajustes.
Condição para as cores, candles ficam verdes quando o fechamento dele é acima das MME 12 e 26.
Condição para as cores, candles ficam vermelhos quando o fechamento dele é abaixo das MME 12 e 26.
Condição para as cores, MME12,26,50 e 200 ficará verde com preço trabalhando acima dela.
Condição para as cores, MME12, 26, 50 e 200 ficará vermelho com preço trabalhando abaixo dela.
Indicação para uso nos time-frame = 5m, 15m, 60m, 240m.(taxas de acerto maior)
Como utilizar o indicador, MME 12 e 26, são as mais importantes e te levaram a mais entradas, porém não devemos levar apenas elas em consideração, temos que analisar todo o contexto para então tomar decisão.
Indicador foi apelidado por mim por " Pega Pullback", ele funciona de uma maneira simples:
Em tendência de alta ou de baixa, o preço geralmente tende a retornar nas médias ou as médias irem até o preço, dito isso é fácil de se observar que onde o preço retorna seria um pullback do último movimento, portanto ao retornar nas médias, o candle que mostra força a favor dessa tendência, na região das EMA's, se torna uma possível entrada, com o seu stop abaixo ou acima desse "pullback" formado, porque o stop vai nesse local, porque geralmente quando o preço retorna nas EMAs elas tendem a segurar e voltar a jogar o preço a favor da tendência.
Minhas observações:
Eu gosto de entrar quando o preço retorna nas médias de maneira suave, sem muito movimento, quando toca na média 12 ou 26 é uma entrada, porém uma entrada sem confirmação, o ganho é maior, porém a chance de ser stopado é mais alta, eu gosto quando o preço fica perto das médias 12 e 26 e deixa um candle pequeno ou doji nesse pullback, minha entrada vai no rompimento desse candle e o stop atrás do candle.
Não existe MILAGRE, NÃO EXISTE TAXA DE ACERTO DE 100%, POR ISSO USE STOP.
Aaaaaaaaaa ia me esquecendo.... e o alvo???
Por ser um setup seguidor de tendência, o legal é deixar um trailing stop ou ir atualizando o stop conforme novos fundos ou topos são formados.
Realizar alvo no 1x1 é bom, setup paga muito!
Realizar alvo no 2x1 é bom de mais, setup paga bem!
Realizar alvo no 3x1 é mais do que bom, setup paga as vezes, ai daqui pra frente, depende de onde você está entrando nesse "PULLBACK", se é na primeira onda, na segunda, se vai lateralizar, o mercado é SOBERANO, põe no bolso que não é mais do mercado, ai é teu!
É isso, dúvidas, manda ai, sugestão, opinião, o que quiser.
Adicionado um símbolo no cruzamento das médias móveis 12 e 26.

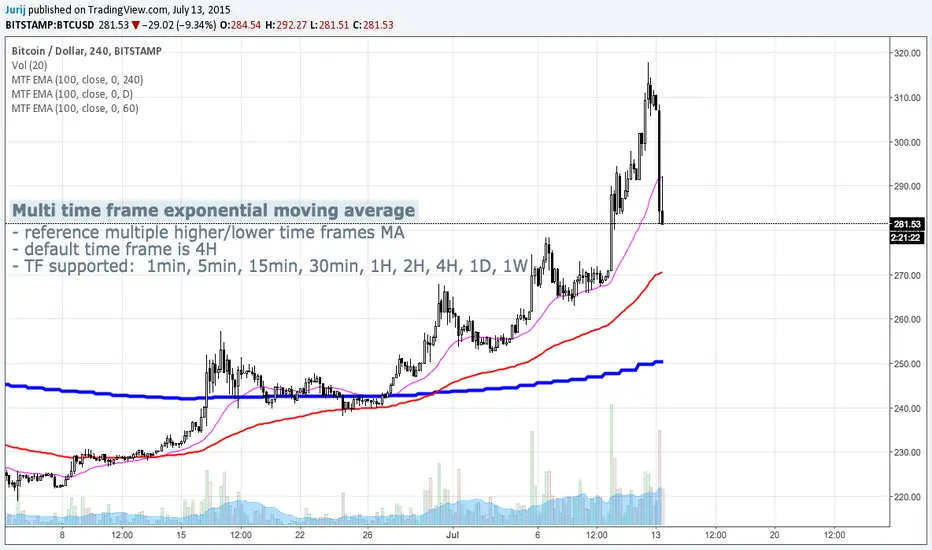
Multi Time Frame Exponential Moving AverageThis indicator allows you to reference exponential moving averages from other time frames
Same indicator for simple moving averages:
Multi Time Frame Exponential Moving Average and dasboardThis Pine script, titled "Multi Time Frame Exponential Moving Average (MTF EMA)," provides an innovative approach for traders who wish to track trends across multiple timeframes without having to switch between different charts. It combines two main features: an indicator displaying exponential moving averages (EMA) on five different time periods, as well as a compact dashboard that synthesizes this information on a single chart window.
The originality of this script lies in its ability to provide a comprehensive analysis of EMA trends across different time intervals, allowing traders to quickly and clearly understand the market dynamics without having to navigate between multiple charts. Rather than switching from one chart to another to observe trends on different time scales, traders can now consult a single dashboard to obtain all the necessary information.
The script uses exponential moving averages (EMA) to identify trends over five time periods: 5 minutes, 15 minutes, 1 hour, 4 hours, and 1 day. The values of the EMAs are calculated based on the closing prices of candles. Bullish or bearish trends are indicated by upward or downward arrows respectively, making it easy to interpret the information on the dashboard.
To use this script, traders can simply add it to their chart on the TradingView platform. They can customize the parameters of the exponential moving averages according to their preferences and choose between a dark or light theme for the dashboard. Then, they can observe trends on different time scales directly on the dashboard, enabling them to make informed trading decisions.
In summary, this script offers a practical and innovative solution for tracking trends across multiple timeframes, combining the efficiency of exponential moving averages with the convenience of a dashboard centralized on a single chart. This allows traders to save time and stay informed about market movements effectively and efficiently.

4 Exponential Moving AveragesBy default you will find 4 Exponential Moving Average: 20,50,100 and 200. These can be modified by you if need it.

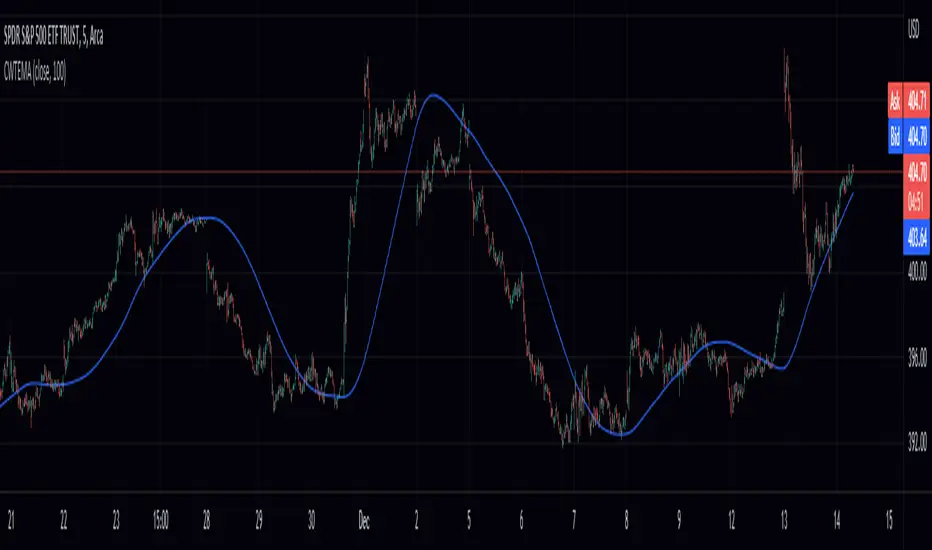
Cumulative Weighted Triple Exponential Moving Average (CWTEMA)This Pine Script code defines an indicator called "CWTEMA" that plots a custom weighted triple exponential moving average (TEMA) on a chart. The indicator takes two inputs: a source series (usually the close price of a security) and a length parameter that specifies the number of periods over which the moving average is calculated.
The code first defines a tema() function, which calculates the TEMA for a given series of data and a given length. The function uses the ta.ema() function from the ta library to compute the exponential moving average of the source data, and then applies the triple exponential moving average formula to calculate the TEMA.
The wma() function is then defined, which calculates the weighted moving average of a given series of data using a set of weights. This function computes the weighted sum of the source data using the given weights, then divides this sum by the sum of the weights to calculate the weighted moving average.
Finally, the cweema() function is defined, which calculates the custom weighted TEMA. This function first computes the weights for each value in the moving average using the given length parameter, then calls the wma() and tema() functions to calculate the weighted moving average using the TEMA values. The cweema() function is then plotted on the chart.
Volume Weighted Exponential Moving AverageThis is a volume weighted exponential moving average. uses exponential weighting and considers volume in the consideration of the average price. This makes for a more accurate "average" than a standard moving average.

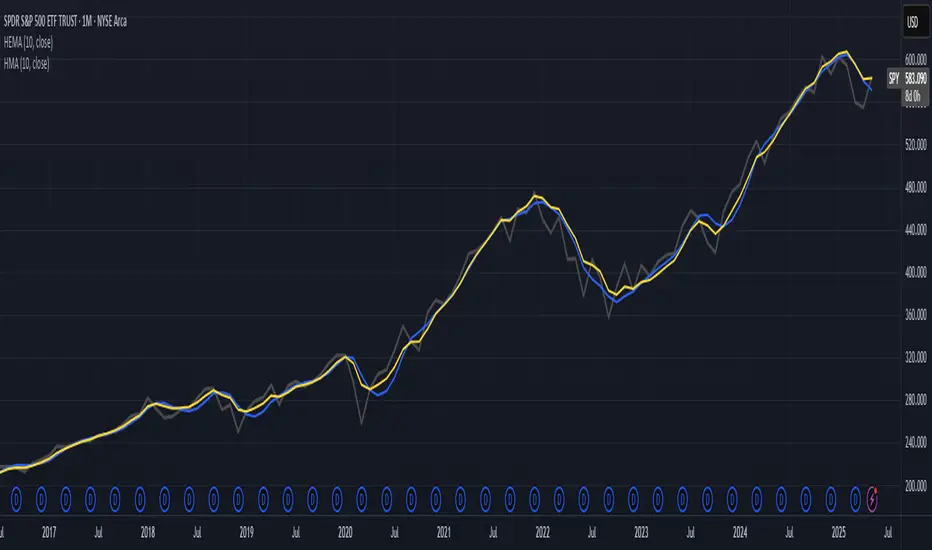
Hull-Exponential Moving Average (HEMA)The Hull Exponential Moving Average (HEMA) is an experimental technical indicator that uses a sequence of Exponential Moving Averages (EMAs) with the same logic as HMA - except with EMAs and not WMAs. It aims to create a responsive yet smooth trend indicator than HMA.
HEMA applies a multi-stage EMA process. Initial EMAs are calculated using alphas derived from logarithmic relationships and the input period. Their outputs are then combined in a de-lagging step, which itself uses a logarithmically derived ratio. A final EMA smoothing pass is then applied to this de-lagged series. This creates a moving average that responds quickly to genuine price changes while maintaining effective noise filtering. The specific alpha calculations and the de-lagging formula contribute to its balance between responsiveness and smoothness.
▶️ **Core Concepts**
Logarithmically-derived alphas: Alpha values for the three EMA stages are derived using natural logarithms and specific formulas related to the input period **N**.
Three-stage EMA process: The calculation involves:
An initial EMA (using **αS**) on the source data.
A second EMA (using **αF**) also on the source data.
A de-lagging step that combines the outputs of the first two EMAs using a specific ratio **r**.
A final EMA (using **αFin**) applied to the de-lagged series.
Specific de-lagging formula: Utilizes a constant ratio **r = ln(2.0) / (1.0 + ln(2.0))** to combine the outputs of the first two EMAs, aiming to reduce lag.
Optimized final smoothing: The alpha for the final EMA (**αFin**) is calculated based on the square root of the period **N**.
Warmup compensation: The internal EMA calculations include a warmup mechanism to provide more accurate values from the initial bars. This involves tracking decay factors (**eS**, **eF**, **eFin**) and applying a compensation factor **1.0 / (1.0 - e_decay)** during the warmup period. A shared warmup duration is determined by the smallest alpha among the three stages.
HEMA achieves its characteristics through this multi-stage EMA process, where the specific alpha calculations and the de-lagging step are key to its responsiveness and smoothness.
▶️ **Common Settings and Parameters**
Period (**N**): Default: 10 | Base lookback period for all alpha calculations | When to Adjust: Increase for longer-term trends and more smoothness, decrease for shorter-term signals and more responsiveness
Source: Default: Close | Data point used for calculation | When to Adjust: Change to HL2, HLC3, or OHLC4 for different price representations
Pro Tip: The HEMA's behavior is sensitive to the **Period** setting due to the non-linear relationships in its alpha calculations. Experiment with values around your typical MA periods. Small changes in **N** can have a noticeable impact, especially for smaller **N** values.
▶️ **Calculation and Mathematical Foundation**
Simplified explanation:
HEMA calculates its value through a sequence of three Exponential Moving Averages (EMAs) with specially derived smoothing factors (alphas).
Two initial EMAs are calculated from the source price, using alphas **αS** and **αF**.
The outputs of these two EMAs are combined into a "de-lagged" series.
This de-lagged series is then smoothed by a third EMA, using alpha **αFin**, to produce the final HEMA value.
All internal EMAs use a warmup compensation mechanism for improved accuracy on early bars.
Technical formula (let **N** be the input period):
1. Alpha for the first EMA (slow component related):
αS = 3.0 / (2.0 * N - 1.0)
2. Lambda for **αS** (intermediate value):
λS = -ln(1.0 - αS)
Note: **αS** must be less than 1, which implies 2N-1 > 3 or N > 2 for **λS** to be well-defined without NaN from ln of non-positive number. The code uses nz() for robustness but the formula implies this constraint.
3. De-lagging ratio **r**:
r = ln(2.0) / (1.0 + ln(2.0))
(This is a constant, approximately 0.409365)
4. Alpha for the second EMA (fast component related):
αF = 1.0 - exp(-λS / r)
5. Alpha for the final EMA smoothing:
αFin = 2.0 / (sqrt(N) / 2.0 + 1.0)
6. Applying the stages:
**OutputS = EMA_internal(source, αS, eS_state, emaS_state)**
**OutputF = EMA_internal(source, αF, eF_state, emaF_state)**
8. Calculate the de-lagged series:
DeLag = (OutputF / (1.0 - r)) - (r * OutputS / (1.0 - r))
9. Calculate the final HEMA:
HEMA = EMA_internal(DeLag, αFin, eFin_state, emaFin_state)
🔍 Technical Note: The HEMA implementation uses a shared warmup period controlled by **aMin** (the minimum of **αS**, **αF**, **αFin**). During this period, each internal EMA stage still tracks its own decay factor (**eS**, **eF**, **eFin**) to apply the correct compensation. The **nz()** function is used in the code to handle potential NaN values from alpha calculations if **N** is very small (e.g., **N=1** would make **αS=3**, **1-αS = -2**, **ln(-2)** is NaN).
▶️ **Interpretation Details**
HEMA provides several key insights for traders:
When price crosses above HEMA, it often signals the beginning of an uptrend
When price crosses below HEMA, it often signals the beginning of a downtrend
The slope of HEMA provides insight into trend strength and momentum
HEMA creates smooth dynamic support and resistance levels during trends
Multiple HEMA lines with different periods can identify potential reversal zones
HEMA is particularly effective for trend following strategies where both responsiveness and noise reduction are important. It provides earlier signals than traditional EMAs while exhibiting less whipsaw than standard HMA in choppy market conditions. The indicator excels at identifying the underlying trend direction while filtering out minor price fluctuations.
▶️ **Limitations and Considerations**
Experimental nature: As an experimental indicator, HEMA may behave differently from established HMA in certain market conditions
Lag characteristics: While designed to reduce lag, HEMA may exhibit slightly more lag than HMA in some scenarios due to the long tail of EMA
Mathematical complexity: The multi-stage calculation with specialized alpha parameters makes the behavior less intuitive to understand
Parameter sensitivity: Performance can vary significantly with different period settings
Complementary tools: Works best when combined with volume analysis or momentum indicators for confirmation
▶️ **References**
Hull, A. (2005). "Hull Moving Average," Technical Analysis of Stocks & Commodities .
RetryClaude can make mistakes. Please double-check responses.